ROI of Ransomware Prevention vs. Paying the Ransom
Compare ransomware prevention investments with a transparent model using loss ranges, control costs, residual exposure, sensitivity, and documented uncertainty.
To discuss how ROI of Ransomware Prevention vs. Paying the Ransom applies to your systems and responsibilities, contact QuantM Technologies for a scoped conversation.
Investment-model principles
Security investment models use uncertain inputs
Every ransomware defense conversation eventually arrives at the same question: is it worth the investment? For SMBs operating on tight margins, security spending competes directly with hiring, marketing, product development, and every other budget priority. The answer requires honest math, comparing the actual cost of prevention against the actual cost of an attack, adjusted for the probability of occurrence.
This analysis presents that math transparently. The conclusion is not close: ransomware prevention is the highest-ROI investment most SMBs can make, not because the risk is theoretical, but because the probability of attack is high, the cost of an unprotected incident is catastrophic, and the cost of prevention is modest by comparison.
Inputs and limitations to disclose
The expected value of paying the ransom, factoring in incomplete recovery, repeated attacks, legal risk, and ongoing costs, is significantly worse than the expected value of investing in prevention.
Frequently Asked Questions
Is managed security too expensive for very small businesses (under 50 employees)?
Size alone does not answer the question. Compare the service scope and full cost with the important systems, internal capacity, current gaps, response requirements, and loss ranges it can reasonably change. A narrower, well-defined service may be more defensible than broad coverage that cannot be evidenced.
How do you calculate the probability of a ransomware attack?
Do not present a precise company probability without defensible data. Use a range informed by exposure, current controls, relevant incident data, and expert judgement, then show how the investment decision changes across that range. Label the input as estimated and assign an owner and review date.
What if we already have basic security, is the upgrade worth it?
Test the current controls before assuming an upgrade is necessary. Review identity, endpoint, email, network, supplier, backup, response, and recovery evidence. Fund the gaps that affect important business services and compare options using the same scope, cost, and success conditions.
Build a defensible ransomware risk-cost model
A ransomware investment model should expose its assumptions. Use ranges for event frequency, outage duration, contribution loss, response and recovery, legal work, customer impact, full control cost, and residual risk. Record the evidence and owner for each input so leadership can see which assumption changes the decision.
Define scope, owners, and proof
Include finance, operations, IT, legal counsel, the insurer or broker, and leadership. Assign one accountable owner and an alternate to each decision. Set the boundary around low, central, and high assumptions with sources, dates, owners, and sensitivity tests. Record exclusions so leadership can see what the assessment does not prove.
Measure what the exercise establishes
One useful measure for this subject is change in annualized loss exposure under explicitly stated assumptions. Pair it with control coverage, age of open exceptions, time to reach decision-makers, restore success, and the percentage of remediation items closed by their due dates. Measures need definitions. For example, “response time” may mean alert acknowledgement, analyst investigation, customer escalation, containment, or full recovery. Those are different clocks.
Source and visual plan
- Carnegie Mellon SEI return on risk investment
- Canadian Centre for Cyber Security, Ransomware playbook
- Canadian Centre for Cyber Security, Ransomware threat outlook 2025 to 2027
- PIPEDA section 10.1
A transparent calculation method
Use annualized loss exposure as a planning aid: estimated annual frequency multiplied by estimated loss per event. Calculate a current-state range, then calculate a residual-risk range after a proposed control. The difference is the estimated annual risk reduction. Subtract the full annual cost of the control, including implementation and internal effort, to compare options. Do not turn the result into a precise promise.
For example, the spreadsheet can use variables rather than published averages: annual frequency from the organization's incident and exposure assessment; outage loss from finance; restoration cost from IT and suppliers; privacy and legal cost ranges from counsel; and control cost from a scoped proposal. Run low, central, and high cases. A sensitivity table should show which input changes the decision. If the result depends almost entirely on a speculative event probability, leadership should see that uncertainty.
Paying a ransom is not an equivalent control option. Payment may fail to restore systems, does not prove copied data was deleted, can create legal and insurance issues, and does not provide a clean operating environment. The meaningful comparison is among investments that reduce exposure, improve detection and containment, sustain operations, and restore trusted services. Legal counsel, law enforcement, and the insurer should be involved in any payment decision during an actual incident.
Retain each model version and the approval date. This gives leadership an audit trail and prevents old assumptions from silently driving later security decisions.
Compare proposals over the same evaluation period and include recurring licences, implementation, internal administration, training, testing, and exit costs. Record benefits that are operational but difficult to monetize separately so they remain visible without being forced into a speculative dollar value.
Have finance reproduce the calculation independently. A model that another reviewer cannot follow is not suitable evidence for approving a security investment or accepting residual risk.
Compare options on the same boundary
Two proposals are comparable only when they cover the same assets, operating hours, implementation work and evaluation period. Note differences in customer responsibilities, data retention, response authority and exit support before comparing totals.
Keep non-financial outcomes visible in a separate section. A tested escalation route, better recovery evidence or clearer ownership may support the investment even when the organization cannot assign a defensible dollar value. Do not manufacture a number to force those benefits into the formula.
Record who approved the model and its review date.
Build a transparent security-investment model
Return on security investment is a decision aid based on uncertain inputs. The model should show current annualized loss exposure, expected residual exposure after a proposed control, the full control cost and the assumptions behind each value. Low and high cases are more honest than a single claimed return.
Scope the review
Use one proposed control and one loss scenario it is intended to change as the working example. The finance and security owners should document event frequency range, loss magnitude, control effectiveness range, implementation cost and recurring effort. This produces a testable boundary and avoids broad statements that cannot be supported by current evidence.
| Decision point | Required evidence | Weak outcome |
|---|---|---|
| Loss event | Business records and stated cost range | A global average replaces company data |
| Frequency | Internal history and comparable evidence with uncertainty | A precise probability is asserted without a source |
| Risk reduction | Control mechanism, coverage and test evidence | Purchase is assumed to eliminate the event |
| Investment cost | Licence, implementation, internal work, testing and exit | Only the vendor fee is counted |
Preserve the result
Ask the team to change each assumption independently and identify which input causes the recommendation to reverse. Keep the test record with the people involved, current configuration, exceptions and follow-up work. Retest completed changes against the original condition.
Continue with the ransomware loss worksheet, candidate preventive controls, and QuantM's cyber insurance readiness service when the reader needs the connected procedure. The links use descriptive anchors and keep the cluster navigable without repeating whole sections.
Put ransomware prevention investment analysis into operation
Model one proposed control against one defined loss scenario before combining several investments. The first analysis should follow these steps:
- Define current loss exposure range. Name the owner, scope and expected result before changing a control.
- Estimate residual exposure and full control cost. Record exceptions and dependencies instead of treating partial coverage as complete.
- Test sensitivity and document uncertainty. Preserve the evidence and assign follow-up work with a retest date.
Evidence to retain
- Loss-event assumptions should show the current scope rather than a planned future state.
- Finance-approved magnitude range should identify the person or system that produced the record.
- Control coverage and evidence should include the date, limitation and unresolved exception.
- Implementation and exit costs should connect the technical result to the affected business service.
Evidence for investment-analysis ages. Review it after a major platform, supplier, identity, policy or staffing change. If the environment no longer matches the tested scope, mark the prior result as historical and schedule a new check.
Review questions
- Which input drives the result?
- What evidence supports frequency?
- Does the control reduce impact or likelihood?
- Are internal costs included?
- When will assumptions be refreshed?
Return unsupported assumptions to finance, security, or the service owner who can supply better evidence. Record when the model must be refreshed and what result would change the decision. The ransomware protection guide shows the wider set of controls from which candidate investments can be selected.
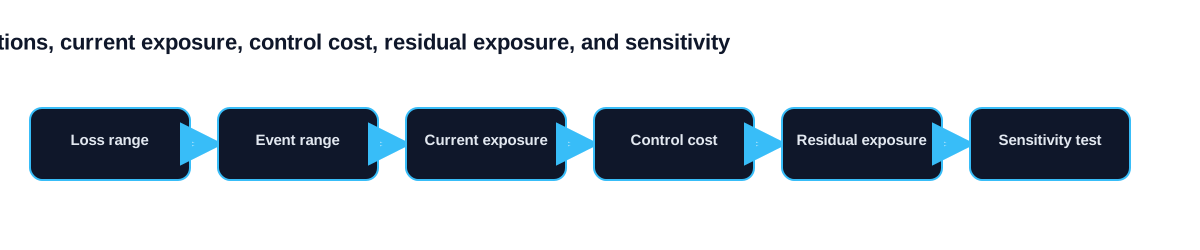
Show the decision at more than one assumption
Security investment models are most useful when leadership can see how the result changes. Calculate a low, planning and high case for loss magnitude and event frequency, then vary the expected effect of the proposed control. If the recommendation changes after a small adjustment, the decision depends on uncertain inputs and needs stronger evidence or a staged commitment.
Include the full cost of implementation, internal effort, training, maintenance and exit. Also state which business services and loss categories are outside the model. A control may reduce the likelihood of initial access, limit the impact of spread or improve recovery time; it should not receive credit for every outcome unless evidence supports that scope. Record the source and owner of each input so the model can be refreshed after a test, technology change or incident. This creates a transparent comparison for budgeting without claiming that a calculation can predict whether ransomware will occur.
Download the ransomware ROSI worksheet
Download the ransomware ROSI worksheet as CSV. It compares current annualized exposure, expected residual exposure, full control cost, net expected benefit, and ROSI across low, planning, and high cases.
The worksheet is a decision aid, not a prediction. Label frequency, loss, and control-effect assumptions as Estimated unless they come from directly measured evidence. Run sensitivity cases and identify the input that changes the recommendation. Keep non-financial outcomes separate when they cannot be assigned a defensible dollar value.